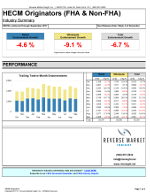
If you’re looking for our usual HECM Originators report, click the image at bottom to skip straight to the report.
Earlier this month we looked at how recent case number assignment trends compare to prior HECM product changes by FHA. In it, we concluded that even though case numbers issued is at a thoroughly depressing level for those of us in the industry, they’re pretty well in the middle of the range in terms of recovery from past product changes.
This time, we’ll focus on the next step in the process and look at conversion of those case numbers issued into endorsements.
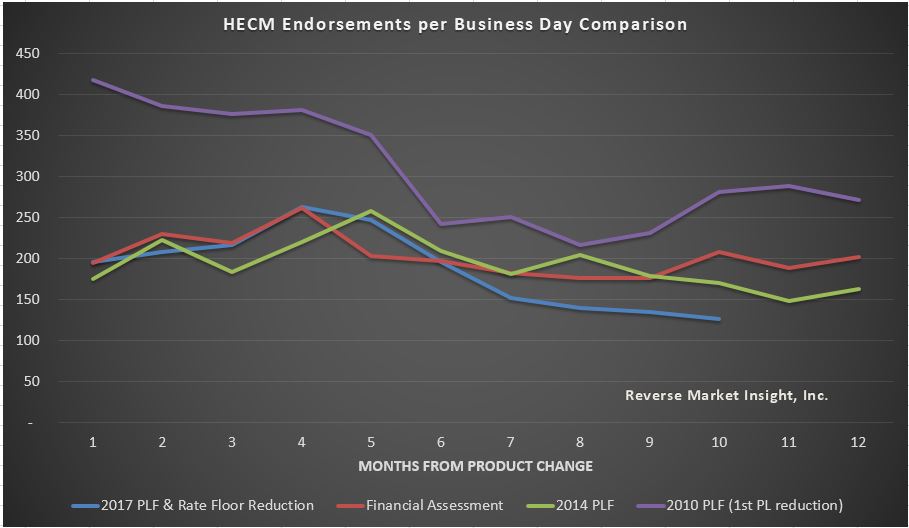
Click for full size image
The chart above starts each endorsement per business day trend line in the month the product change took effect – October 2017 for our most recent example. We know that endorsements will take time to show the effects of a product change, and indeed each of the trend lines displays a notable decline in the middle of the graph.
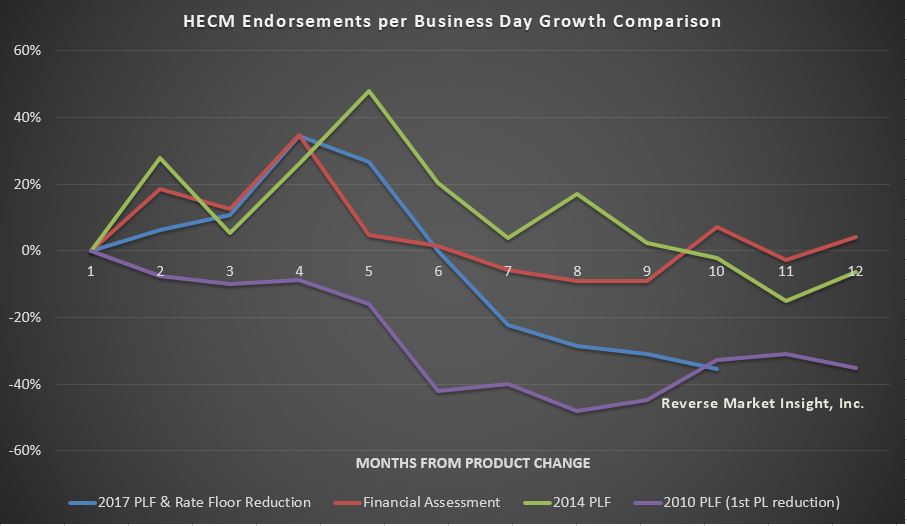
Click for larger image
This next chart corrects for the different starting points in each product change, but also showing very clearly that the very first PLF reduction back in October 2009 sparked the biggest percentage decline in endorsements the industry has seen, reaching a low point of -48% 8 months after the change. What’s not comforting about this chart is that our most recent change is closer to that worst case scenario than either of the two more recent changes, checking in at -35% in month 10, whereas the 2009/2010 PLF change had already recovered to -33% by that point.
If case numbers issued show the most recent change to be similar to the other 3 big product changes but endorsements are flashing danger signs, where is the breakdown?
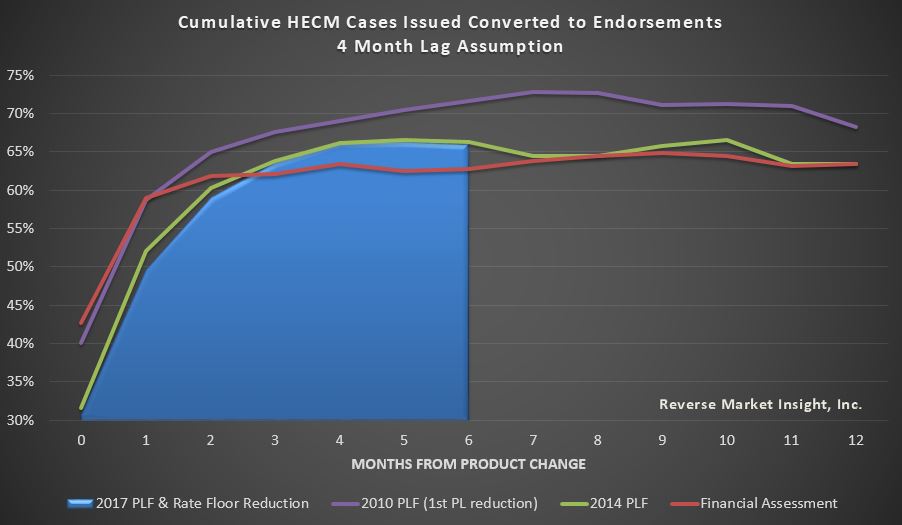
Click for larger image
Conversion rates.
- Our most recent product change is almost precisely following the cumulative conversion trend from 4 years prior (2014 PLF) at least through the first 6 months
- The only prior change with lower conversion figures at this point is Financial Assessment, which started significantly higher (similar to 2010 PLF) but then flattened dramatically as lenders worked through the exact qualification parameters to the most significant underwriting shift the product has yet seen
- 2010 PLF comparison line is influenced the most by an additional month of extra case numbers issued before the product change that we’re not including here, which explains the higher initial conversion rates
A few notes on how we’re looking at conversion rates here:
- Cumulative conversion rates include the typically higher than usual case numbers issued in the last month prior to product change – a big reason why conversions start so low
- We assume 4 months of lag time from case number issuance to endorsement
- Each month, we add both the new case numbers issued and the endorsements from 4 months later to the cumulative numerator and denominator
Keep posted for the last chapter in this series.
Click the image below to access the full HECM Originators report.