April saw HECM endorsements decline -1.4% to 2,088 loans. Following up on our recent theme of HECMs being just part of the overall reverse mortgage picture, the regional growth/decline picture looks a lot like you’d expect if HECM volume was being undercut by proprietary reverse mortgage market share.
Four of the ten regions grew HECM endorsement volume in April compared to March, but the more interesting element is looking year to date:
- Just 2 of the 10 regions have grown year to date: Great Plains and Mid Atlantic
- Both of those regions contain more states with limited or no proprietary reverse mortgage availability: NE, IA, KS, MD, DE, WV
- In looking at 8 currently available proprietary RM products, there is a distinct relationship between HECM growth rates and proprietary product availability
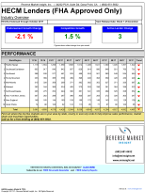
As usual, the full lender rankings and volume is in the full report if you click on the image below.