May’s HECM endorsement volume was down -15.6% from 2013 but up 1.5% from 2012. It’s tempting to say that 2014 will come in near 2012 totals, but the downside scenario is closer to 2005.
- Jan – May cumulative volume is down -12.6% from last year and -2% from 2012
- 2012 finished with 52,883 endorsements, which means we need to average 4,240 endorsements per month for Jul-Dec to match it and that’s just about the average of May/Jun
We haven’t put out an update on this chart in a while, but it really tells a lot of the story for the industry changes and struggles using case numbers issued as our general measure.
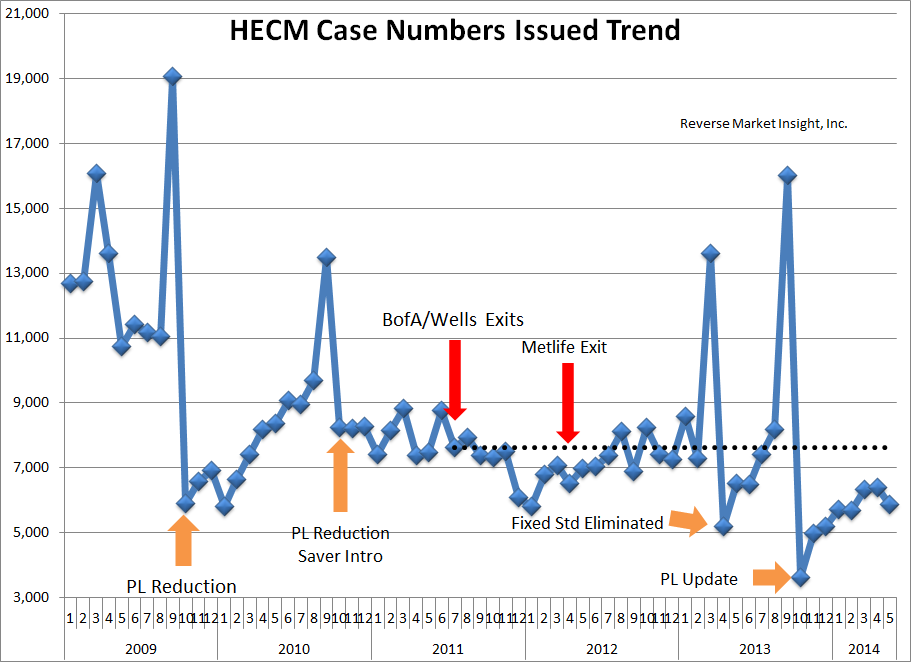
The tempting conclusion to draw here is that FHA program changes (orange arrows) are the major driver of volatility – and on a short term basis that would be true. What gets a bit lost in this monthly perspective is the medium/long term ceiling being lowered by the lender exits (red arrows) as the industry loses distribution.
Check out how trends are shaking out in your state/county/city/zip in the full report below (click on the image) or feel free to give us a shout if you’d like a personal deep dive to see how this information can focus your opportunities.
