We normally think of a ‘killer app’ as a perfect use that grows a new technology from curiosity to must have item. Just as email and search engines helped us all figure out what the internet could mean to our lives, so much that now we can’t imagine our lives without them and internet is considered a utility alongside electricity and water by most Americans.
One day our industry will find a ‘killer app’ for the reverse mortgage product that takes us from 2.24% market penetration (as of December 2010) to something much, much greater and a standard consideration in retirement planning.
But for this month, killer app meant just one thing when we saw the January application numbers: our industry is still struggling for volume. Before we get too gloomy it should be said that several clients have mentioned that February application volumes are surprisingly strong, but there is no doubt that January’s numbers took a step in the wrong direction.
January applications totaled just 7,396, down -10.6% from December but up 27.4% from a year ago. We’ve seen January applications decline each of the past 3 years as noted on the chart above.
Endorsements grew 6.8% from December to 6,904 (the highest total in a year) and were down just -1.7% from a year ago. We’re almost sure to see endorsement growth next month based on application trends recently, particularly as endorsement volumes really started falling off the cliff in March 2010 (-1,202 in March 2010 alone).
We also saw active lenders increase again in February at a slightly faster pace (9.9%) than endorsements.
In the market breakdown on pages 3-4, we noticed that a few of the hardest hit property markets are seeing HECM volume increases: Fresno +22.4%, Sacramento +8.5%, Tucson +14%. We’re not saying that all the bubble markets are back, as there are more markets still down like Miami (-50.1%) and Phoenix (-14.3%). All the same, it’s great to see some signs of life in these markets!
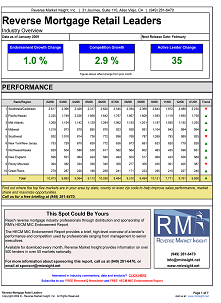
Click on the image below for this month’s report.


